Debugging & diagnostics
When a workflow doesn't do what you expect — how to see what's happening before it runs, while it runs, and in your logs.
When a workflow misbehaves, there are three places to look — and they line up with the three moments things go wrong: before a run (the graph isn’t valid), during a run (a node fails or returns the wrong thing), and after, in your logs. This page is the tour.
Catch problems before running
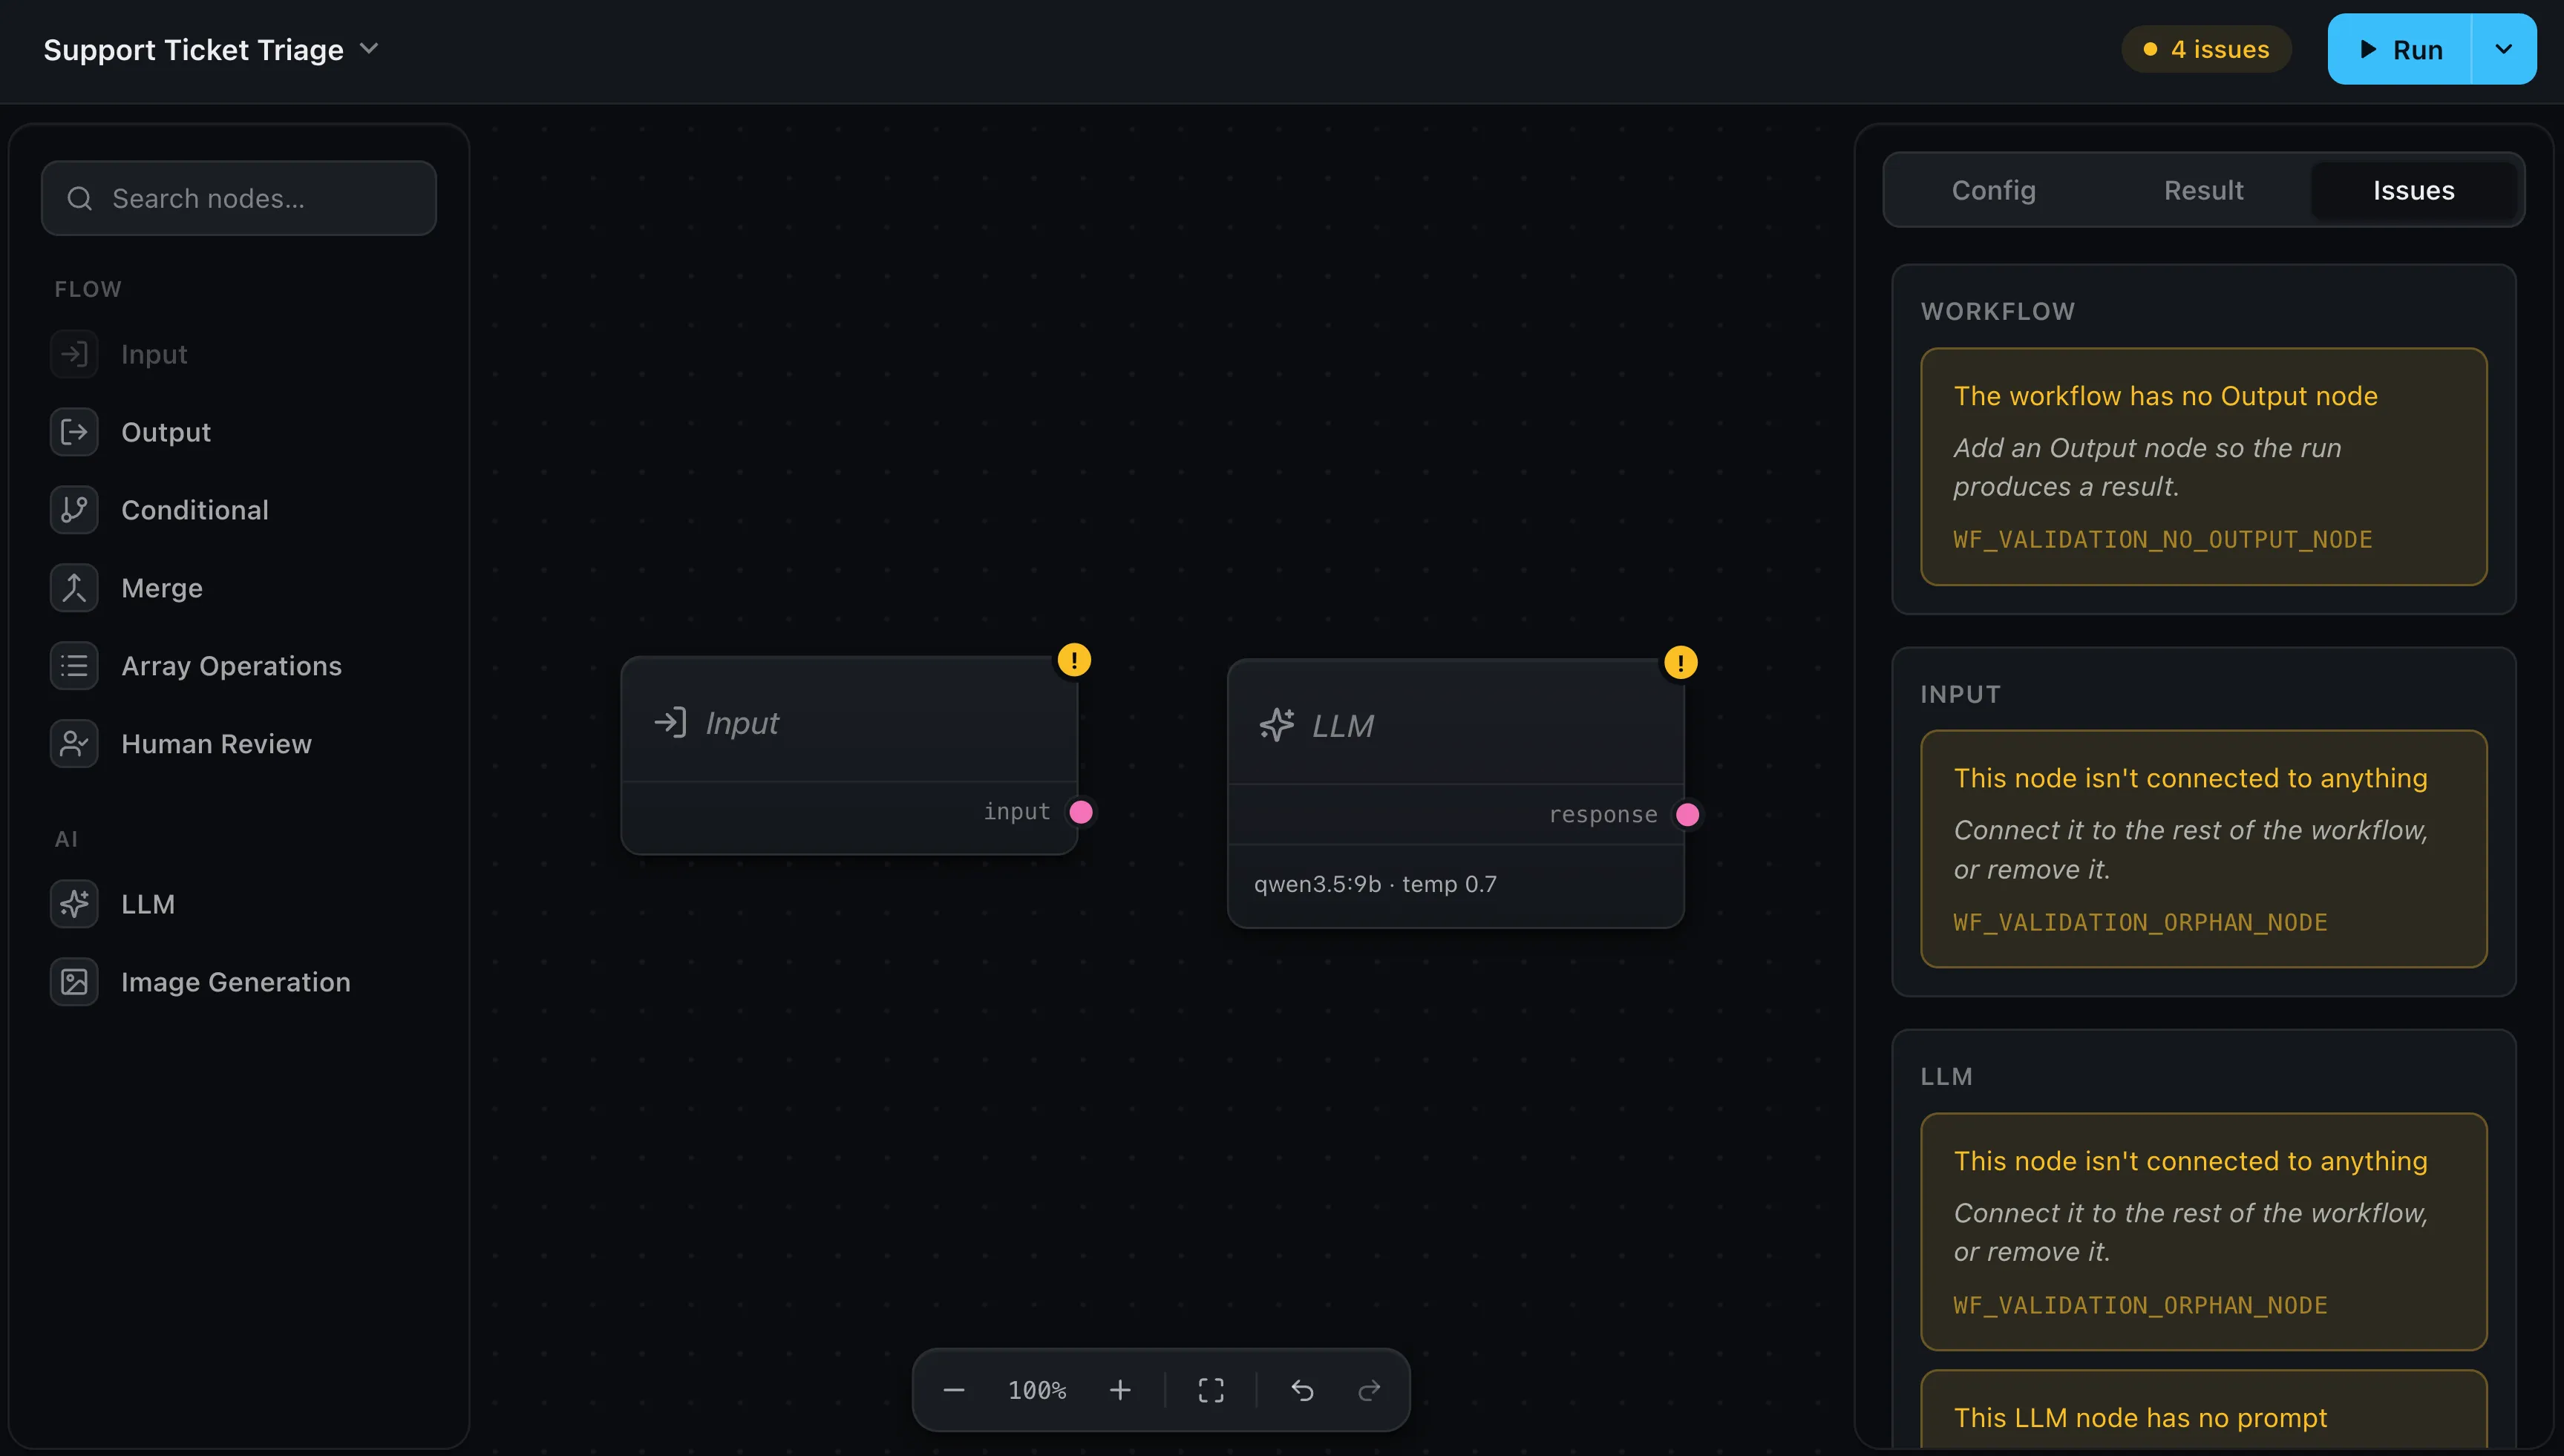
As you build, the editor validates the graph live and collects anything wrong in the Issues tab, with a count in the header. Each issue is a plain-language problem plus an actionable hint — it reads like advice, not a stack trace:
- “The workflow has no Output node” — add one so the run produces a result.
- “This node isn’t connected to anything” — wire it in, or remove it.
- “This LLM node has no prompt” — give the model something to act on.
- …a required input with nothing supplying it, a model that isn’t configured, a tool that’s no longer in the catalog, and so on.
Clearing these before you hit Run saves a round-trip. The Issues tab is a build-time aid, so it’s hidden in read-only and preview modes — there’s nothing to fix there.
Watch a run in the editor
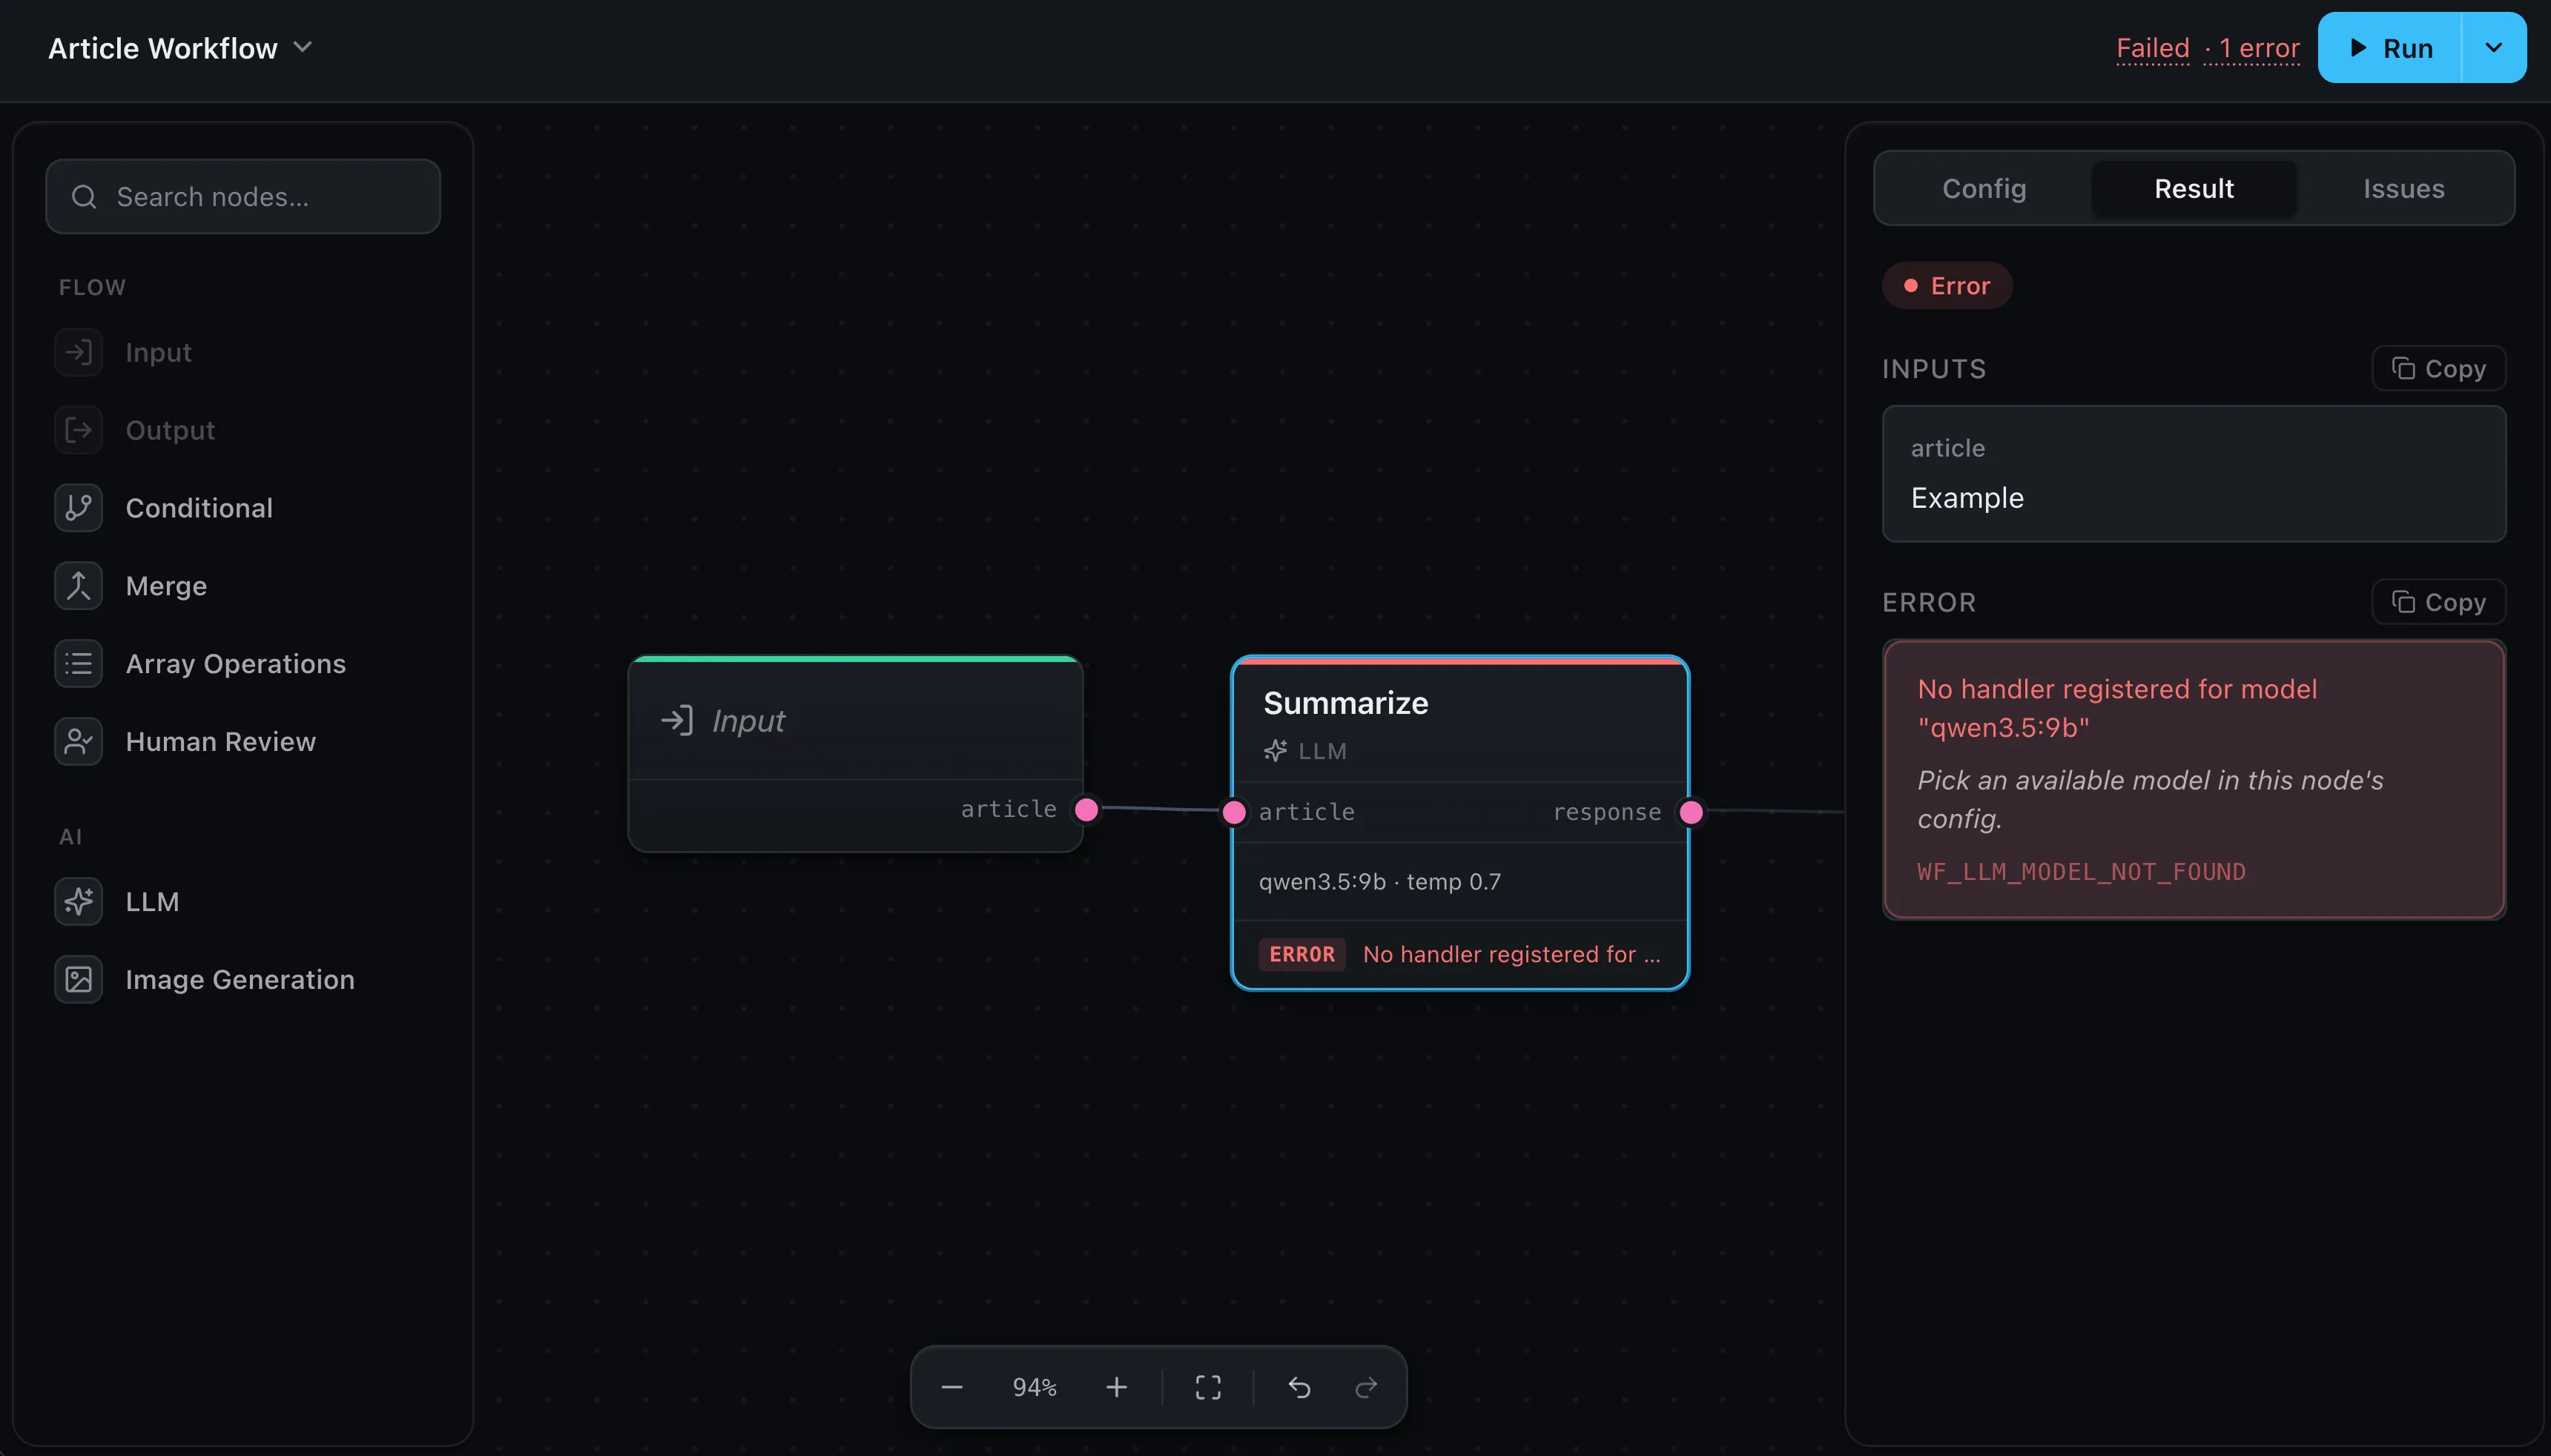
Press Run and the canvas narrates itself: every node shows its state live — running, done, error, or skipped — so you can see exactly how far a run got and where it stopped. Select any node to read its Result. A node that fails turns red and shows the error’s message and hint inline, and the header sums it up (“Failed · 1 error”). For a human watching, this is the fastest loop.
Runtime logs
For a headless run — on your server, or any time you want a closer look at what
executed — turn on diagnostics on the runtime. That’s where a run’s trace comes
from; the editor’s own debug covers only editor-side issues (a failed autosave, a
node type with no models configured), so for run logs you set debug on
createRuntime:
const runtime = createRuntime({
  handlers: { /* your node handlers */ },
  debug: true,
})
debug: true is shorthand for “write to the console.” A run then prints a readable
trace:
[wayflow] INFO  run started runId=r_8f2a
[wayflow] DEBUG node input "Topic" completed runId=r_8f2a nodeId=n_topic duration=1ms
[wayflow] DEBUG node llm "Outline" started runId=r_8f2a nodeId=n_outline
[wayflow] DEBUG node llm "Outline" completed runId=r_8f2a nodeId=n_outline duration=1.4s
[wayflow] INFO  run completed runId=r_8f2a duration=1.5s
Every line has the same shape: a [wayflow] prefix, a level, a message, then
structured key=value fields. So in your log provider you can filter on
[wayflow], follow one run by its runId, or jump straight to failures — which
carry the WayflowError code and message as searchable strings:
[wayflow] ERROR node llm "Outline" failed runId=r_3c1d nodeId=n_outline code=WF_LLM_MODEL_NOT_FOUND message=No handler registered for model "gpt-5.4-mini"
[wayflow] ERROR run failed runId=r_3c1d code=WF_LLM_MODEL_NOT_FOUND message=No handler registered for model "gpt-5.4-mini"
Searching for [wayflow] ERROR surfaces every failure, and a code= like
WF_LLM_MODEL_NOT_FOUND is a stable string you can take straight to your log search.
To send the trace somewhere other than the console — a structured logger, an
aggregator — pass your own logger instead. It receives the same message and the
same fields, so you keep the structure:
const runtime = createRuntime({
  handlers: { /* … */ },
  logger: {
    debug: () => {},
    info: (message, fields) => myLogger.info(fields, message),
    warn: (message, fields) => myLogger.warn(fields, message),
    error: (message, fields) => myLogger.error(fields, message),
  },
})
A logger you pass always wins: debug only decides whether to spin up the default
console logger, so your own logger is used whether or not debug is set.
On a server
The console output goes to stdout and stderr — wherever your host already collects
logs. Reach for a custom logger when you want the runId / nodeId / code
fields forwarded into your logging pipeline as structured data, rather than parsed
back out of a line.
Where next
- On a server — where headless runs and their logs live
- Providers & models — a missing handler is a common first error
- Where workflows run — the runtime, browser and server